

torch.nn.modules which helps to automatically moved
them across CPU/GPU/TPU devices with Pytorch Lightning.
BasePointLoss
Module
Base class for point loss functions.
Parameters:
1. Scale-dependent Errors
These metrics are on the same scale as the data.Mean Absolute Error (MAE)
MAE
BasePointLoss
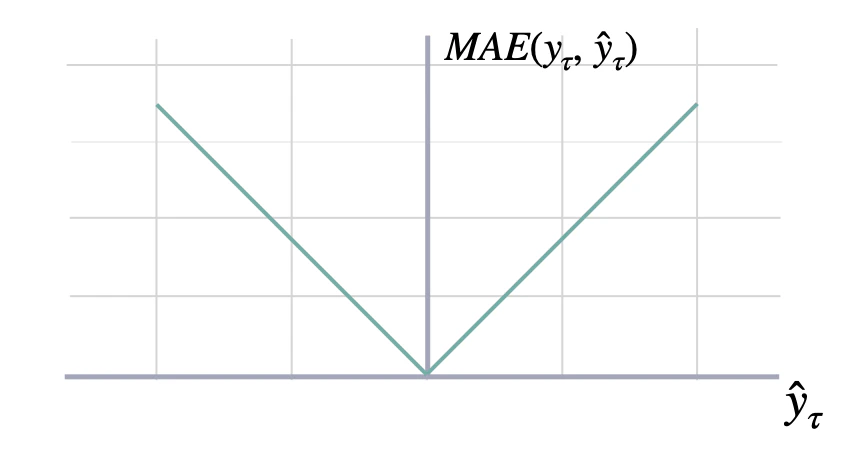
Mean Absolute Error.
Calculates Mean Absolute Error between y and y_hat. MAE measures the relative prediction
accuracy of a forecasting method by calculating the deviation of the prediction and the true
value at a given time and averages these devations over the length of the series.
Parameters:
MAE.__call__
Returns:
Mean Squared Error (MSE)
MSE
BasePointLoss
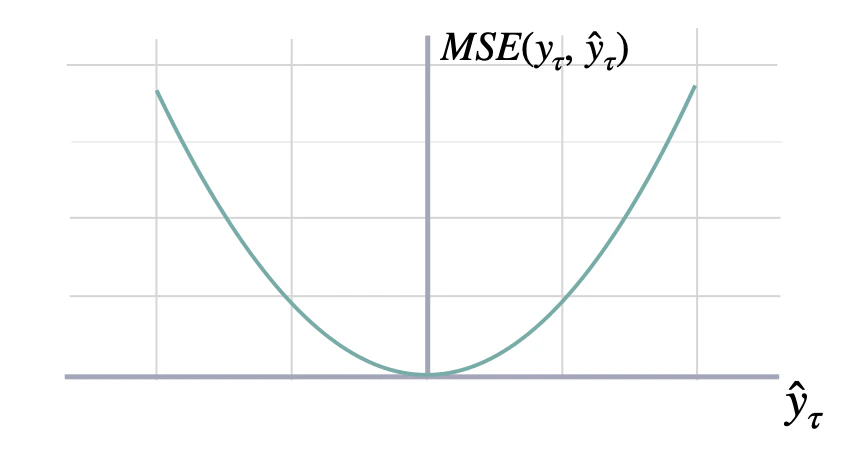
Mean Squared Error.
Calculates Mean Squared Error between y and y_hat. MSE measures the relative prediction
accuracy of a forecasting method by calculating the squared deviation of the prediction and the true
value at a given time, and averages these devations over the length of the series.
Parameters:
MSE.__call__
Returns:
Root Mean Squared Error (RMSE)
RMSE
BasePointLoss
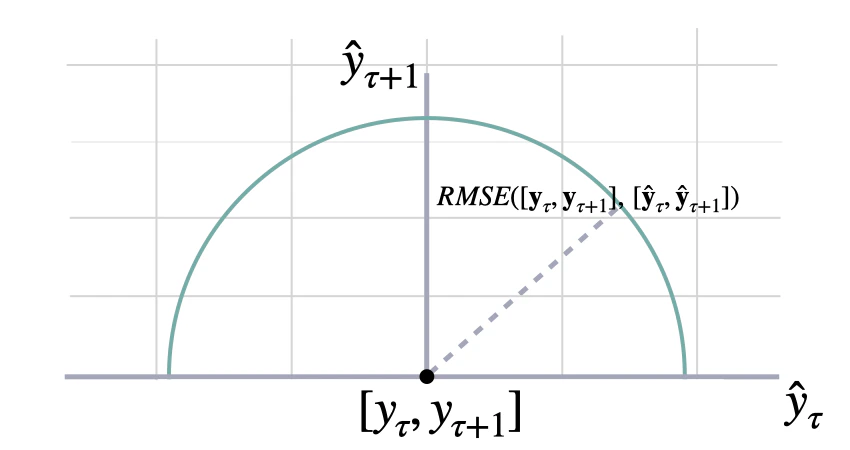
Root Mean Squared Error.
Calculates Root Mean Squared Error between y and y_hat. RMSE measures the relative prediction
accuracy of a forecasting method by calculating the squared deviation of the prediction and the observed value at
a given time and averages these devations over the length of the series.
Finally the RMSE will be in the same scale as the original time series so its comparison with other
series is possible only if they share a common scale. RMSE has a direct connection to the L2 norm.
Parameters:
RMSE.__call__
Returns:
2. Percentage errors
These metrics are unit-free, suitable for comparisons across series.Mean Absolute Percentage Error (MAPE)
MAPE
BasePointLoss
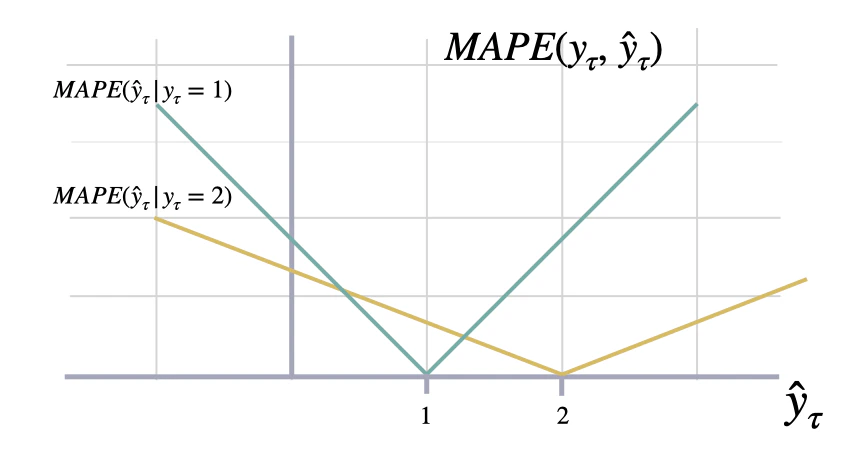
Mean Absolute Percentage Error
Calculates Mean Absolute Percentage Error between
y and y_hat. MAPE measures the relative prediction
accuracy of a forecasting method by calculating the percentual deviation
of the prediction and the observed value at a given time and
averages these devations over the length of the series.
The closer to zero an observed value is, the higher penalty MAPE loss
assigns to the corresponding error.
Parameters:
MAPE.__call__
Returns:
Symmetric MAPE (sMAPE)
SMAPE
BasePointLoss
Symmetric Mean Absolute Percentage Error
Calculates Symmetric Mean Absolute Percentage Error between
y and y_hat. SMAPE measures the relative prediction
accuracy of a forecasting method by calculating the relative deviation
of the prediction and the observed value scaled by the sum of the
absolute values for the prediction and observed value at a
given time, then averages these devations over the length
of the series. This allows the SMAPE to have bounds between
0% and 200% which is desireble compared to normal MAPE that
may be undetermined when the target is zero.
Parameters:
SMAPE.__call__
Returns:
3. Scale-independent Errors
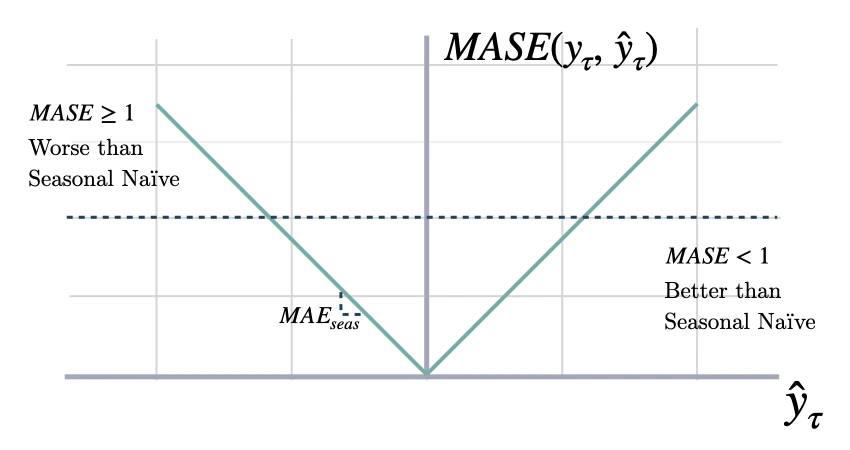
These metrics measure the relative improvements versus baselines.Mean Absolute Scaled Error (MASE)
MASE
BasePointLoss
Mean Absolute Scaled Error
Calculates the Mean Absolute Scaled Error between
y and y_hat. MASE measures the relative prediction
accuracy of a forecasting method by comparinng the mean absolute errors
of the prediction and the observed value against the mean
absolute errors of the seasonal naive model.
The MASE partially composed the Overall Weighted Average (OWA),
used in the M4 Competition.
Parameters:
MASE.__call__
Returns:
Relative Mean Squared Error (relMSE)
relMSE
BasePointLoss
Relative Mean Squared Error
Computes Relative Mean Squared Error (relMSE), as proposed by Hyndman & Koehler (2006)
as an alternative to percentage errors, to avoid measure unstability.
Parameters:
relMSE.__call__
Returns:
4. Probabilistic Errors
These methods use statistical approaches for estimating unknown probability distributions using observed data. Maximum likelihood estimation involves finding the parameter values that maximize the likelihood function, which measures the probability of obtaining the observed data given the parameter values. MLE has good theoretical properties and efficiency under certain satisfied assumptions. On the non-parametric approach, quantile regression measures non-symmetrically deviation, producing under/over estimation.Quantile Loss
QuantileLoss
BasePointLoss
Quantile Loss.
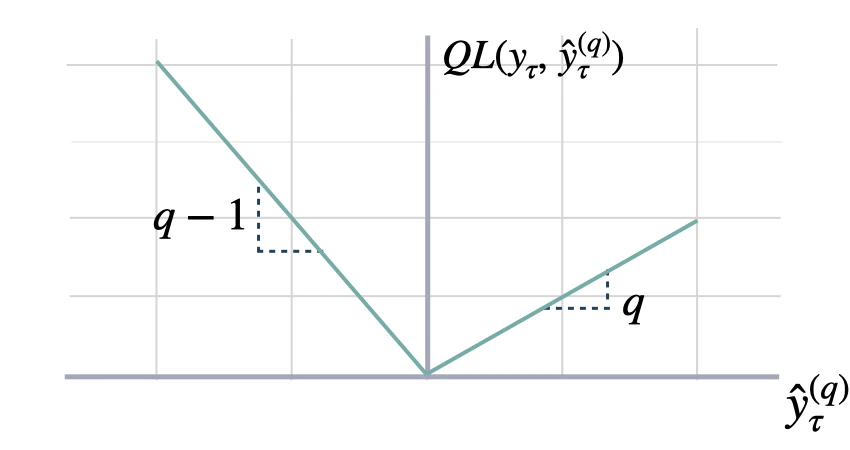
Computes the quantile loss between y and y_hat.
QL measures the deviation of a quantile forecast.
By weighting the absolute deviation in a non symmetric way, the
loss pays more attention to under or over estimation.
A common value for q is 0.5 for the deviation from the median (Pinball loss).
Parameters:
QuantileLoss.__call__
Returns:
Multi Quantile Loss (MQLoss)
MQLoss
BasePointLoss
Multi-Quantile loss
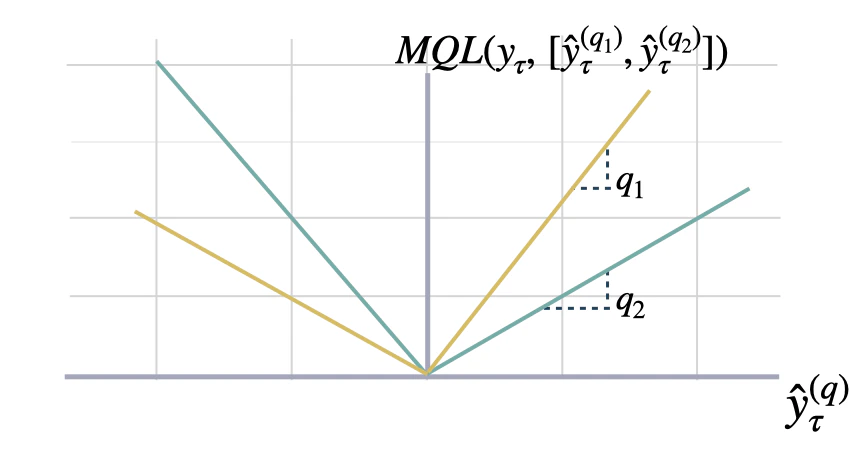
Calculates the Multi-Quantile loss (MQL) between y and y_hat.
MQL calculates the average multi-quantile Loss for
a given set of quantiles, based on the absolute
difference between predicted quantiles and observed values.
The limit behavior of MQL allows to measure the accuracy
of a full predictive distribution with
the continuous ranked probability score (CRPS). This can be achieved
through a numerical integration technique, that discretizes the quantiles
and treats the CRPS integral with a left Riemann approximation, averaging over
uniformly distanced quantiles.
Parameters:
MQLoss.__call__
Returns:
Implicit Quantile Loss (IQLoss)
QuantileLayer
Module
Implicit Quantile Layer from the paper IQN for Distributional Reinforcement Learning.
Code from GluonTS: https://github.com/awslabs/gluonts/blob/61133ef6e2d88177b32ace4afc6843ab9a7bc8cd/src/gluonts/torch/distributions/implicit_quantile_network.py
IQLoss
QuantileLoss
Implicit Quantile Loss.
Computes the quantile loss between y and y_hat, with the quantile q provided as an input to the network.
IQL measures the deviation of a quantile forecast.
By weighting the absolute deviation in a non symmetric way, the
loss pays more attention to under or over estimation.
Parameters:
IQLoss.__call__
Returns:
DistributionLoss
DistributionLoss
Module
DistributionLoss
This PyTorch module wraps the torch.distribution classes allowing it to
interact with NeuralForecast models modularly. It shares the negative
log-likelihood as the optimization objective and a sample method to
generate empirically the quantiles defined by the level list.
Additionally, it implements a distribution transformation that factorizes the
scale-dependent likelihood parameters into a base scale and a multiplier
efficiently learnable within the network’s non-linearities operating ranges.
Available distributions:
- Poisson
- Normal
- StudentT
- NegativeBinomial
- Tweedie
- Bernoulli (Temporal Classifiers)
- ISQF (Incremental Spline Quantile Function)
Returns:
DistributionLoss.__call__
mask tensor.
Parameters:
Returns:
Poisson Mixture Mesh (PMM)
PMM
Module
Poisson Mixture Mesh
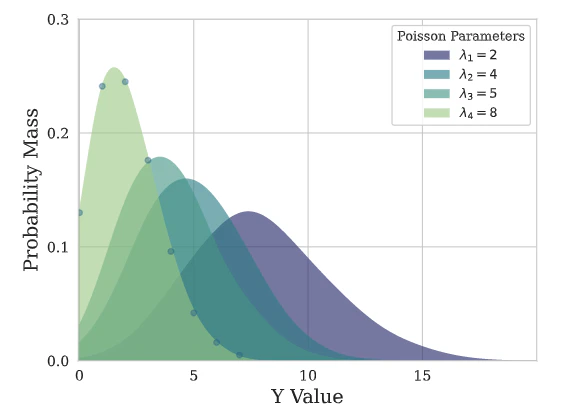
This Poisson Mixture statistical model assumes independence across groups of
data , and estimates relationships within the group.
Parameters:
PMM.__call__
mask tensor.
Parameters:
Returns:
Gaussian Mixture Mesh (GMM)
GMM
Module
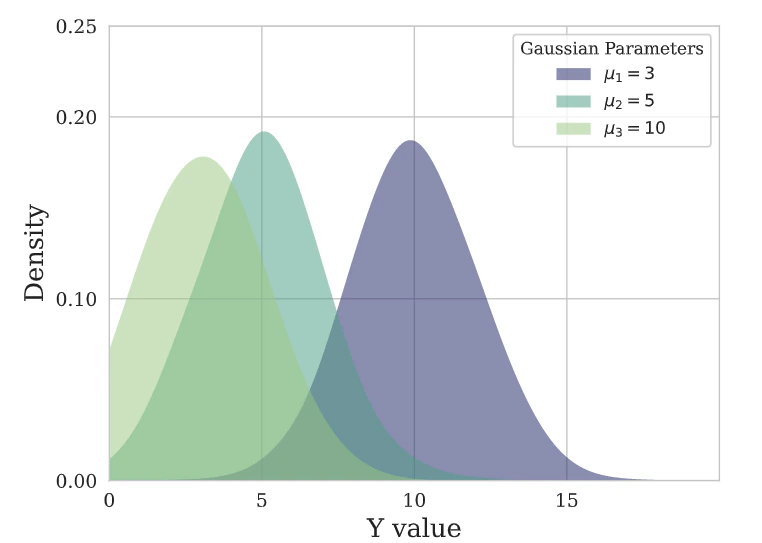
Gaussian Mixture Mesh
This Gaussian Mixture statistical model assumes independence across groups of
data , and estimates relationships within the group.
Parameters:
GMM.__call__
mask tensor.
Parameters:
Returns:
Negative Binomial Mixture Mesh (NBMM)
NBMM
Module
Negative Binomial Mixture Mesh
This N. Binomial Mixture statistical model assumes independence across groups of
data , and estimates relationships within the group.
Parameters:
NBMM.__call__
mask tensor.
Parameters:
Returns:
5. Robustified Errors
Huber Loss
HuberLoss
BasePointLoss
Huber Loss
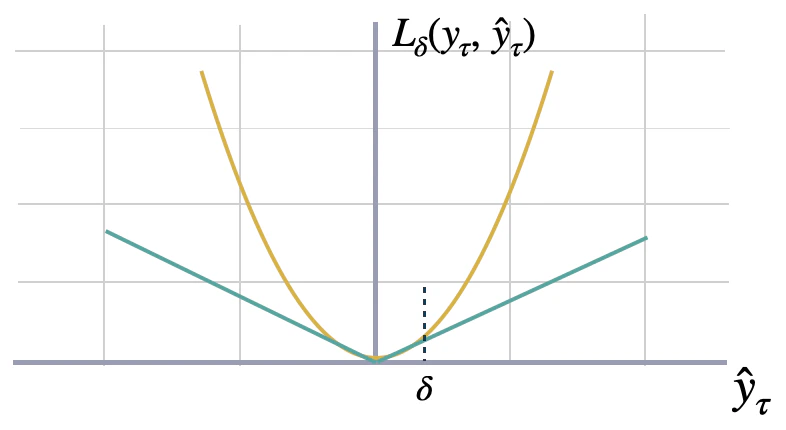
The Huber loss, employed in robust regression, is a loss function that
exhibits reduced sensitivity to outliers in data when compared to the
squared error loss. This function is also refered as SmoothL1.
The Huber loss function is quadratic for small errors and linear for large
errors, with equal values and slopes of the different sections at the two
points where =.
where is a threshold parameter that determines the point at which the loss transitions from quadratic to linear,
and can be tuned to control the trade-off between robustness and accuracy in the predictions.
Parameters:
HuberLoss.__call__
Returns:
Tukey Loss
TukeyLoss
BasePointLoss
Tukey Loss
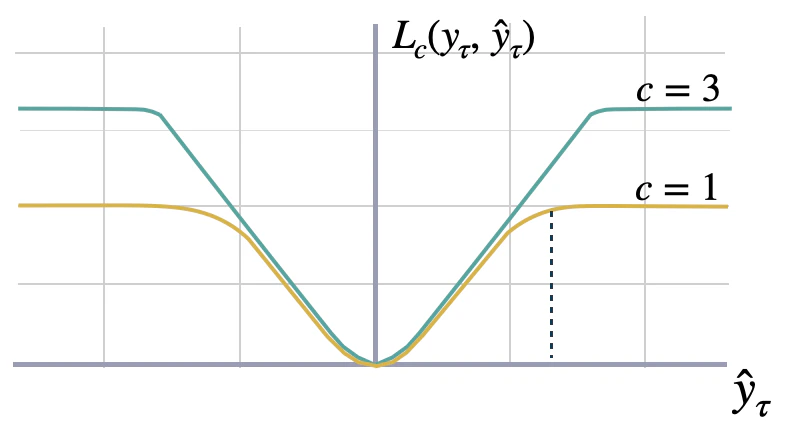
The Tukey loss function, also known as Tukey’s biweight function, is a
robust statistical loss function used in robust statistics. Tukey’s loss exhibits
quadratic behavior near the origin, like the Huber loss; however, it is even more
robust to outliers as the loss for large residuals remains constant instead of
scaling linearly.
The parameter in Tukey’s loss determines the ”saturation” point
of the function: Higher values of enhance sensitivity, while lower values
increase resistance to outliers.
Please note that the Tukey loss function assumes the data to be stationary or
normalized beforehand. If the error values are excessively large, the algorithm
may need help to converge during optimization. It is advisable to employ small learning rates.
Parameters:
TukeyLoss.__call__
Returns:
Huberized Quantile Loss
HuberQLoss
BasePointLoss
Huberized Quantile Loss
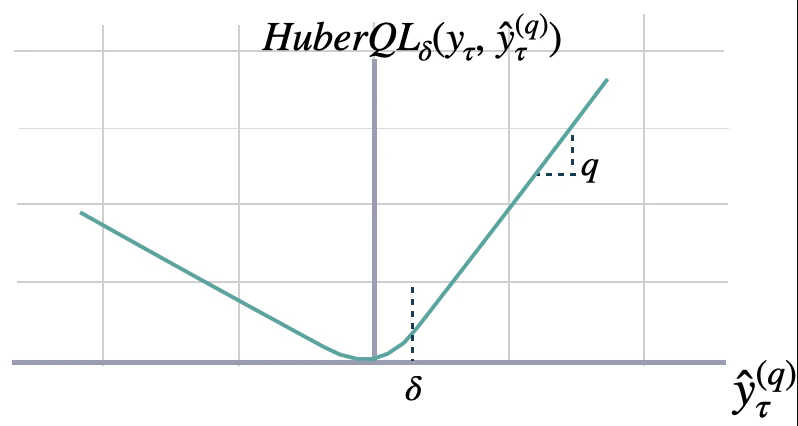
The Huberized quantile loss is a modified version of the quantile loss function that
combines the advantages of the quantile loss and the Huber loss. It is commonly used
in regression tasks, especially when dealing with data that contains outliers or heavy tails.
The Huberized quantile loss between y and y_hat measure the Huber Loss in a non-symmetric way.
The loss pays more attention to under/over-estimation depending on the quantile parameter ;
and controls the trade-off between robustness and accuracy in the predictions with the parameter .
Parameters:
HuberQLoss.__call__
Returns:
Huberized MQLoss
HuberMQLoss
BasePointLoss
Huberized Multi-Quantile loss
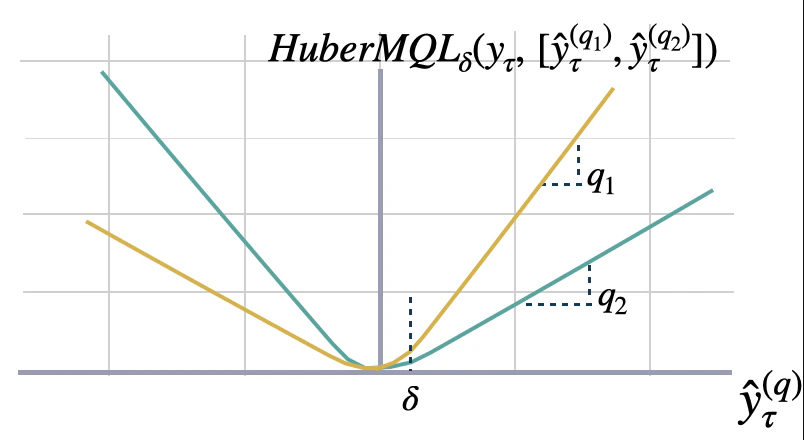
The Huberized Multi-Quantile loss (HuberMQL) is a modified version of the multi-quantile loss function
that combines the advantages of the quantile loss and the Huber loss. HuberMQL is commonly used in regression
tasks, especially when dealing with data that contains outliers or heavy tails. The loss function pays
more attention to under/over-estimation depending on the quantile list parameter.
It controls the trade-off between robustness and prediction accuracy with the parameter .
Parameters:
HuberMQLoss.__call__
Returns:
Huberized IQLoss
HuberIQLoss
HuberQLoss
Implicit Huber Quantile Loss
Computes the huberized quantile loss between y and y_hat, with the quantile q provided as an input to the network.
HuberIQLoss measures the deviation of a huberized quantile forecast.
By weighting the absolute deviation in a non symmetric way, the
loss pays more attention to under or over estimation.
Parameters:
HuberIQLoss.__call__
Returns:
6. Others
Accuracy
Accuracy
BasePointLoss
Accuracy
Computes the accuracy between categorical y and y_hat.
This evaluation metric is only meant for evalution, as it
is not differentiable.
Accuracy.__call__
Returns:
Scaled Continuous Ranked Probability Score (sCRPS)
sCRPS
BasePointLoss
Scaled Continues Ranked Probability Score
Calculates a scaled variation of the CRPS, as proposed by Rangapuram (2021),
to measure the accuracy of predicted quantiles y_hat compared to the observation y.
This metric averages percentual weighted absolute deviations as
defined by the quantile losses.
where is the estimated quantile, and
are the target variable realizations.
Parameters:
sCRPS.__call__
Returns: